Building a Meshtastic Network Monitoring Suite
A Dockerized monitoring suite for Meshtastic mesh networks — SPLAT! radio coverage, redundancy analysis, and a Vue.js map viewer, built without modifying upstream code.
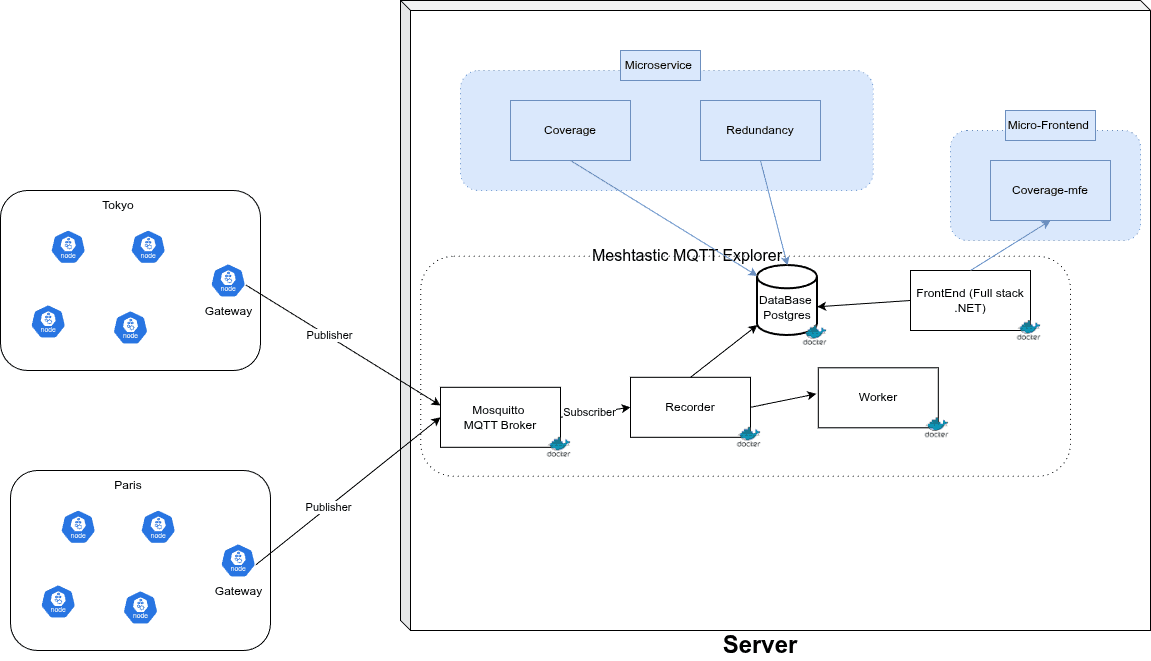
Context
Meshtastic is an open-source mesh radio platform used for off-grid communication. The existing Meshtastic MQTT Explorer visualizes live node data, but it does not answer two critical planning questions: where does each node actually cover? and where are the gaps if a node goes down?
I built meshnetwork as a complete monitoring extension — radio coverage prediction, redundancy scoring, and a dedicated map viewer — all containerized and running alongside the upstream explorer with zero modifications to its codebase.
Timeline: Personal project, 2025
Repo: github.com/soufian-elouazzani/meshnetwork · Docs: meshnetwork-docs
What I built
- Coverage Service — Python daemon that uses SPLAT! and NASA SRTM terrain data to predict radio coverage per node and export GeoJSON polygons (~15 seconds per node with terrain caching).
- Redundancy Service — Detects overlaps between coverage zones, scores redundancy on a 1–5 scale, and highlights weak points where a single node failure would leave a gap.
- Vue.js microfrontend — Leaflet-based real-time map viewer on port 3001, separate from the main Blazor front end on port 80.
- Docker Compose stack — PostgreSQL, Mosquitto MQTT, Python daemons, .NET 9 explorer, and Vue viewer orchestrated together.
Technical decisions
- Extend, don't fork — Integrating via MQTT topics and shared PostgreSQL rather than patching upstream keeps updates painless and demonstrates microservice boundaries.
- SPLAT! + SRTM for terrain-aware coverage — Flat-earth approximations fail in mountainous regions; real elevation data produces polygons operators can trust.
- Separate Vue viewer — The redundancy and coverage layers need different interaction patterns than the live node explorer; a dedicated front end keeps each UI focused.
Results and takeaways
- Operators can plan node placement before deploying hardware in the field.
- Redundancy scoring turns subjective "we probably have overlap" into actionable weak-point maps.
- For clients and recruiters: this shows end-to-end system design — backend services, data pipelines, container orchestration, and a polished map UI.
Stack
| Layer | Technologies |
|---|---|
| Backend | Python daemons, PostgreSQL, Mosquitto MQTT |
| Front end | Vue.js, Leaflet, .NET 9 / Blazor (upstream) |
| Radio modeling | SPLAT!, NASA SRTM terrain data |
| Infrastructure | Docker Compose |
Quick start
git clone https://github.com/soufian-elouazzani/meshnetwork.git
cd meshnetwork/docker
sudo docker compose up -d
- Main map:
http://localhost - Coverage viewer:
http://localhost:3001
See the full README and architecture docs for diagrams and screenshots.